Getting started
Welcome to multicloud-diagrams 👋 This section will walk you through the basic installation process and provide a quick example to get you started. If you’re looking for more advanced features and customization options, be sure to explore the subsequent sections in our comprehensive documentation.
Table of contents
- Dependency details
- On-line Documentation is Dynamic and generated from Tests
- Installation
- Usage
- Open drawio editor and position nodes manually
- Reuse coordinates from previous diagram version
- Arrange Layout automatic positioning
Dependency details
python-3.11
python-3.10
python-3.9
python-3.8
python-3.7
The multicloud-diagrams package is a Python library that provides support for major Python versions, including 3.7, 3.8, 3.9, 3.10, and 3.11. The package ensures compatibility with these Python versions by running tests using a Git workflow. These tests are designed to verify that the library functions as expected across each mentioned Python version.
Compatibility tests are included for latest LTS Python versions that have Security Support.
| Release | Released | Security Support | Latest |
|---|---|---|---|
| 3.11 | 24 Oct 2022 | 24 Oct 2027 | 3.11.4 |
| 3.10 | 04 Oct 2021 | 04 Oct 2026 | 3.10.12 |
| 3.9 | 05 Oct 2020 | 05 Oct 2025 | 3.9.1 |
| 3.8 | 14 Oct 2019 | 14 Oct 2024 | 3.8.17 |
| 3.7 | 26 Jun 2018 | 27 Jun 2023 | 3.7.17 |
You can use
multicloud-diagramswithPythonversions<3.7that do not have officialSecurity Supportwith your own verification.Since
27 Jun 2023Python3.7has no security support,multicloud-diagramsare still support this version (pipeline with full features compatibility check), however on next Python LTS releases it will be deprecated. This evolution will enable us to seamlessly embrace the latest language features not accessible in the 3.7 release.
The package is readily accessible on PyPI: https://pypi.org/project/multicloud-diagrams/ for easy installation and usage. As an open-source project, it encourages community participation and welcomes contributions from developers https://github.com/tsypuk/multicloud-diagrams Whether you want to use the package’s functionalities or contribute to its improvement, it offers a user-friendly experience, backed by an active and engaged community.
On-line Documentation is Dynamic and generated from Tests
All the resources within this documentation, including code snippets, rendered images, and XML dumps, are compiled and generated through tests conducted during the publishing process.
This comprehensive testing not only ensures verification but also guarantees that the provided examples remain current, up-to-date, aligning seamlessly with the latest API updates and method signatures.
Furthermore, the rendering process showcases authentic images, presenting an accurate desired output.
Installation
You can install multicloud-diagrams using pip, the package manager for Python:
pip install multicloud-diagrams
If you are using poetry follow these instructions:
poetry add multicloud-diagrams
Edit your project.toml and add multicloud-diagrams as dependency:
[ tool.poetry.dependencies ]
  python = "^3.7"
  pyyaml = "^6.0"
  multicloud-diagrams = ^"0.3.116"
Usage
The minimum configuration requires importing MultiCloudDiagrams, adding vertices, connecting them with links and exporting to output file.
Let’s add 2 vertices IAM Role and Lambda function:
# given
# Create a new cloud diagram
mcd = MultiCloudDiagrams()

# when
func_arn = 'arn:aws:lambda:eu-west-1:123456789012:function:prod-lambda-name'
mcd.add_vertex(node_id=func_arn, node_name='prod-lambda-name', node_type='lambda_function')

role_arn = 'arn:aws:iam::123456789012:role/prod-lambda-name'
mcd.add_vertex(node_id=role_arn, node_name='role-lambda-name', node_type='iam_role')
mcd.add_link(src_node_id=f'lambda_function:{func_arn}', dst_node_id=f'iam_role:{role_arn}')

mcd.export_to_file('./tmp/diagram.drawio')
Open drawio editor and position nodes manually
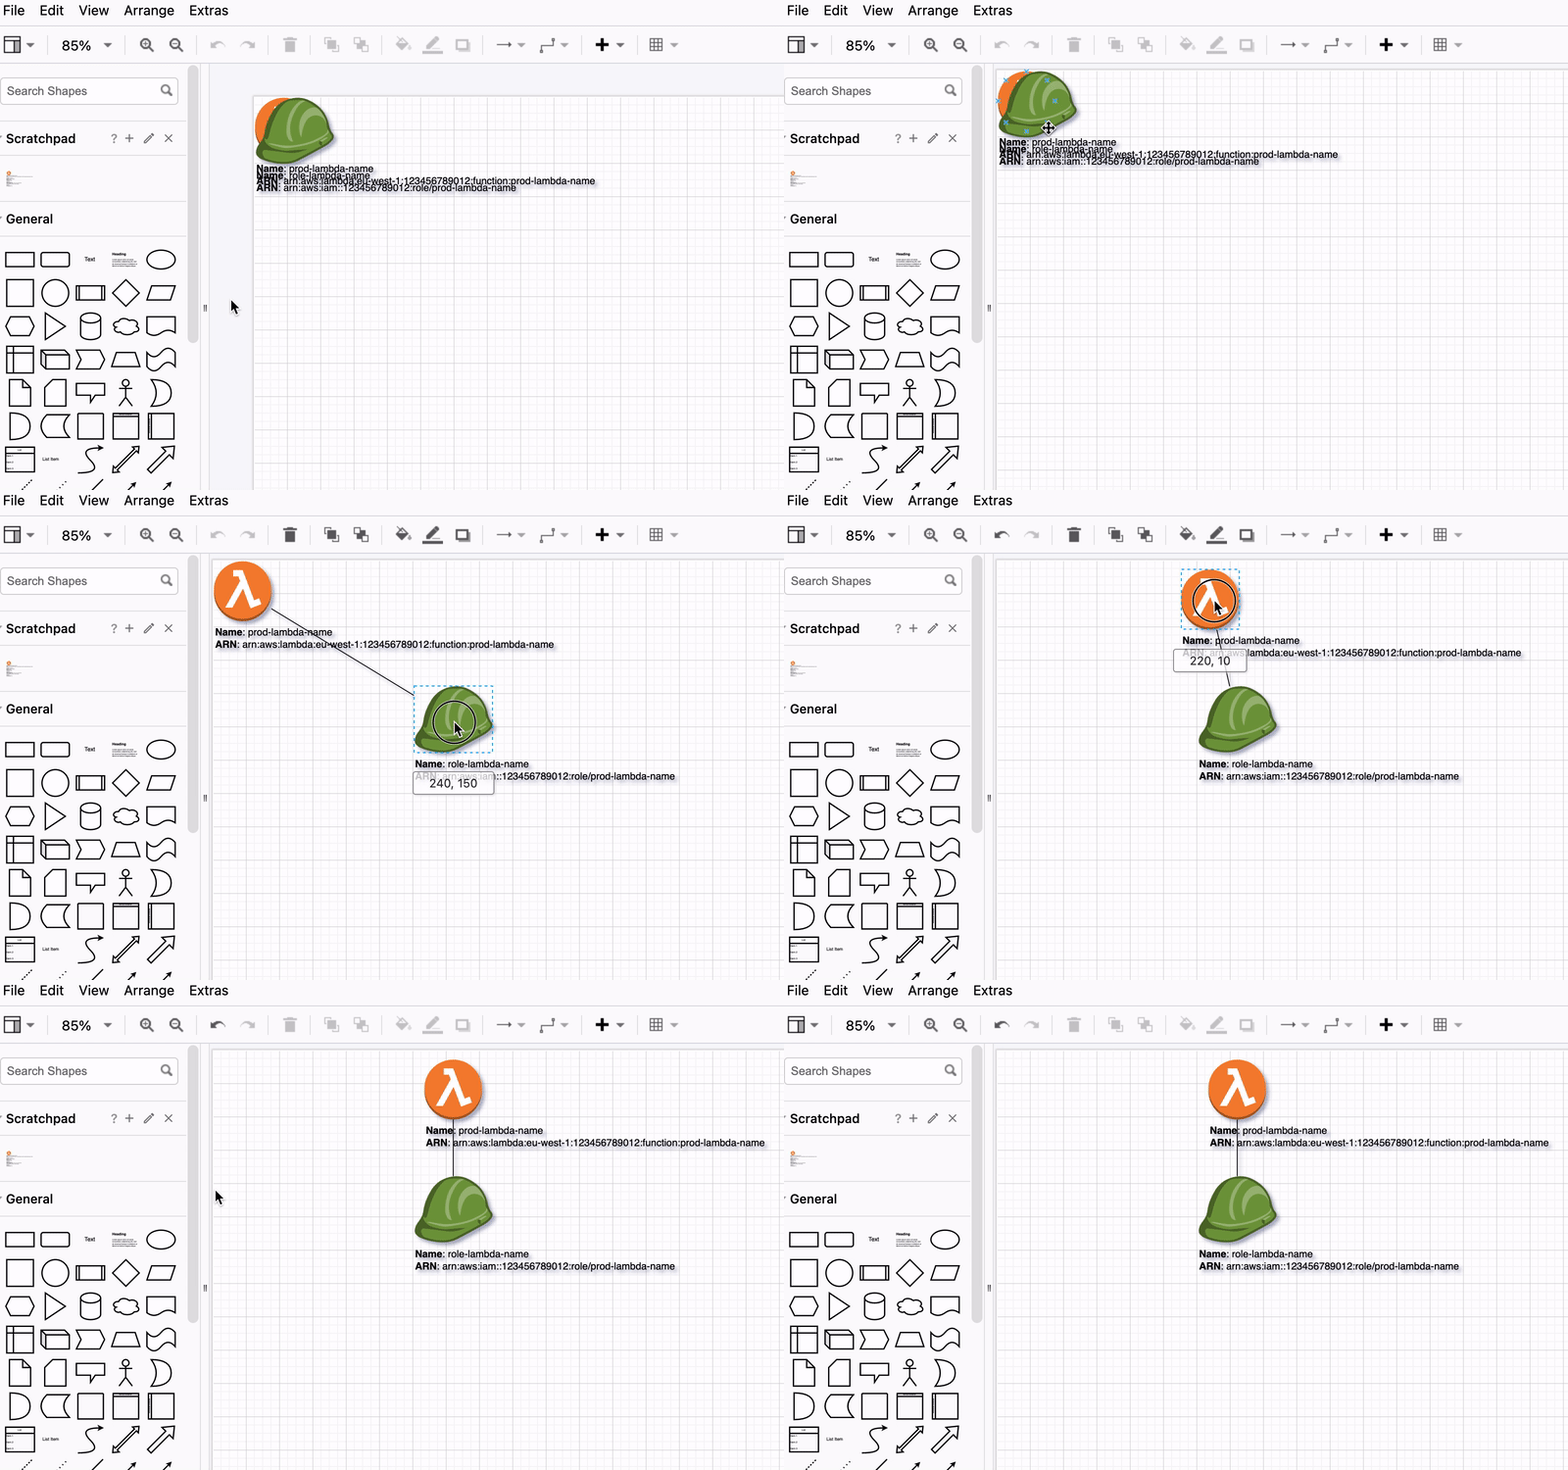
Considering that we haven’t specified the coordinates or distribution algorithm yet (which will be detailed in the next instructions), by default, all elements will be placed in the left-top corner. We have the flexibility to move and position them according to our preferences.

Reuse coordinates from previous diagram version
New (v0.2.1)
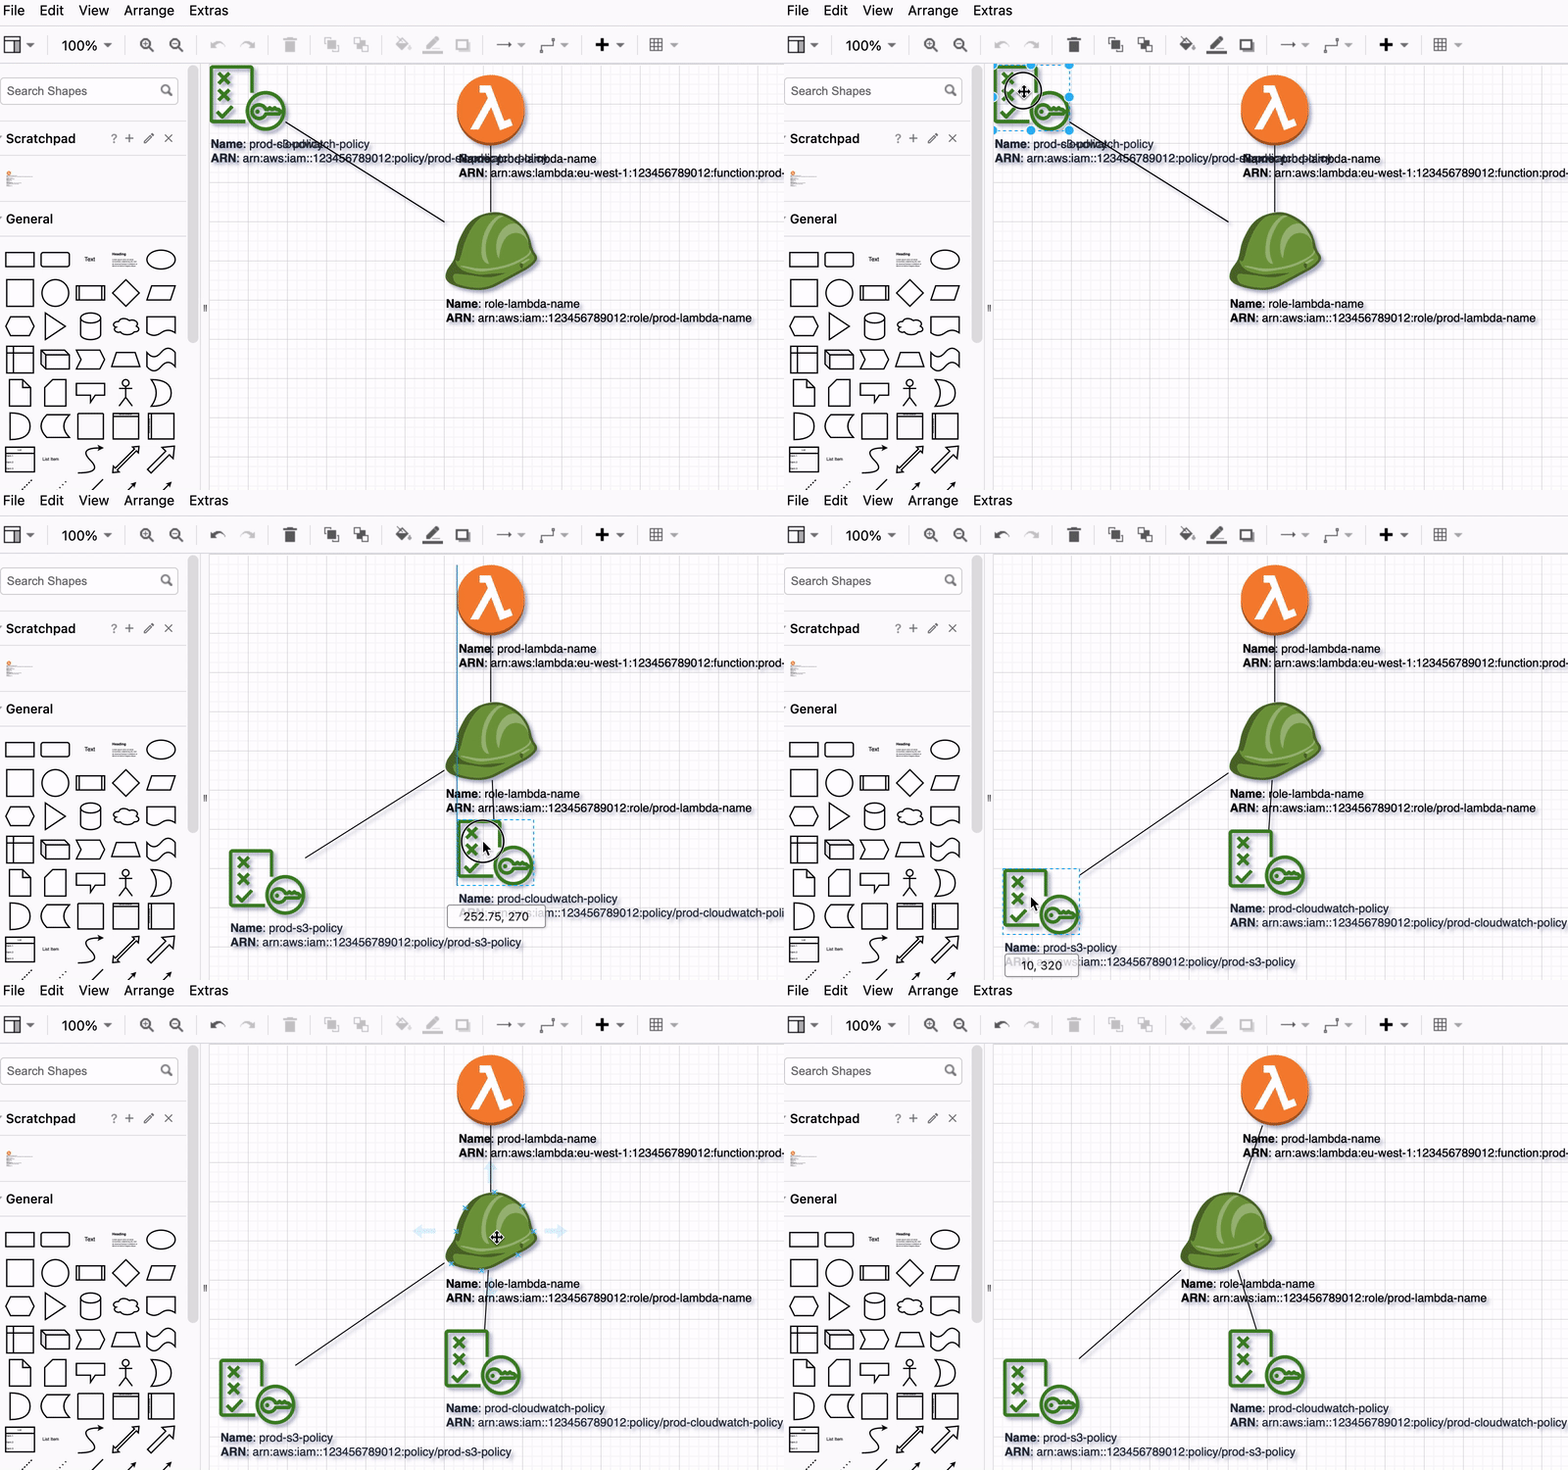
When we provide the path to an existing drawio file, the current context framework will read the coordinates of all vertices from the previous diagram and reuse them. As a result, any new elements will be added to the top-left corner by default, while existing elements will retain their original coordinates. If certain vertices were removed from the framework, they will not be present in the resulting drawio file.
Now, we are adding 2 more vertices IAM Permissions to see how it works.
# given
# Create a new cloud diagram
mcd = MultiCloudDiagrams()

# when
output_file = './tmp/diagram.drawio'
mcd.read_coords_from_file(output_file)

func_arn = 'arn:aws:lambda:eu-west-1:123456789012:function:prod-lambda-name'
mcd.add_vertex(node_id=func_arn, node_name='prod-lambda-name', node_type='lambda_function')

role_arn = 'arn:aws:iam::123456789012:role/prod-lambda-name'
mcd.add_vertex(node_id=role_arn, node_name='role-lambda-name', node_type='iam_role')

cw_policy_arn = "arn:aws:iam::123456789012:policy/prod-cloudwatch-policy"
mcd.add_vertex(node_id=cw_policy_arn, node_name='prod-cloudwatch-policy', node_type='iam_policy')

s3_policy_arn = "arn:aws:iam::123456789012:policy/prod-s3-policy"
mcd.add_vertex(node_id=s3_policy_arn, node_name='prod-s3-policy', node_type='iam_policy')

mcd.add_link(src_node_id=f'lambda_function:{func_arn}', dst_node_id=f'iam_role:{role_arn}')
mcd.add_link(f'iam_role:{role_arn}', f'iam_policy:{cw_policy_arn}')
mcd.add_link(f'iam_role:{role_arn}', f'iam_policy:{s3_policy_arn}')

# We can write to same Diagram
mcd.export_to_file(output_file)

# Or write to a new Diagram version
mcd.export_to_file('./tmp/diagram_v2.drawio')
This approach allows for efficient placement of new elements while preserving the layout of existing ones based on the previous diagram’s coordinates.

By leveraging this feature, we can implement versioning effectively by consistently reading coordinates from the previous file, which includes a timestamp (e.g., datetime in the file name). Subsequently, we write the updated elements to a new file. This functionality proves invaluable for tracking historical records and facilitating a comprehensive comparison of infrastructure evolution over time.
Arrange Layout automatic positioning

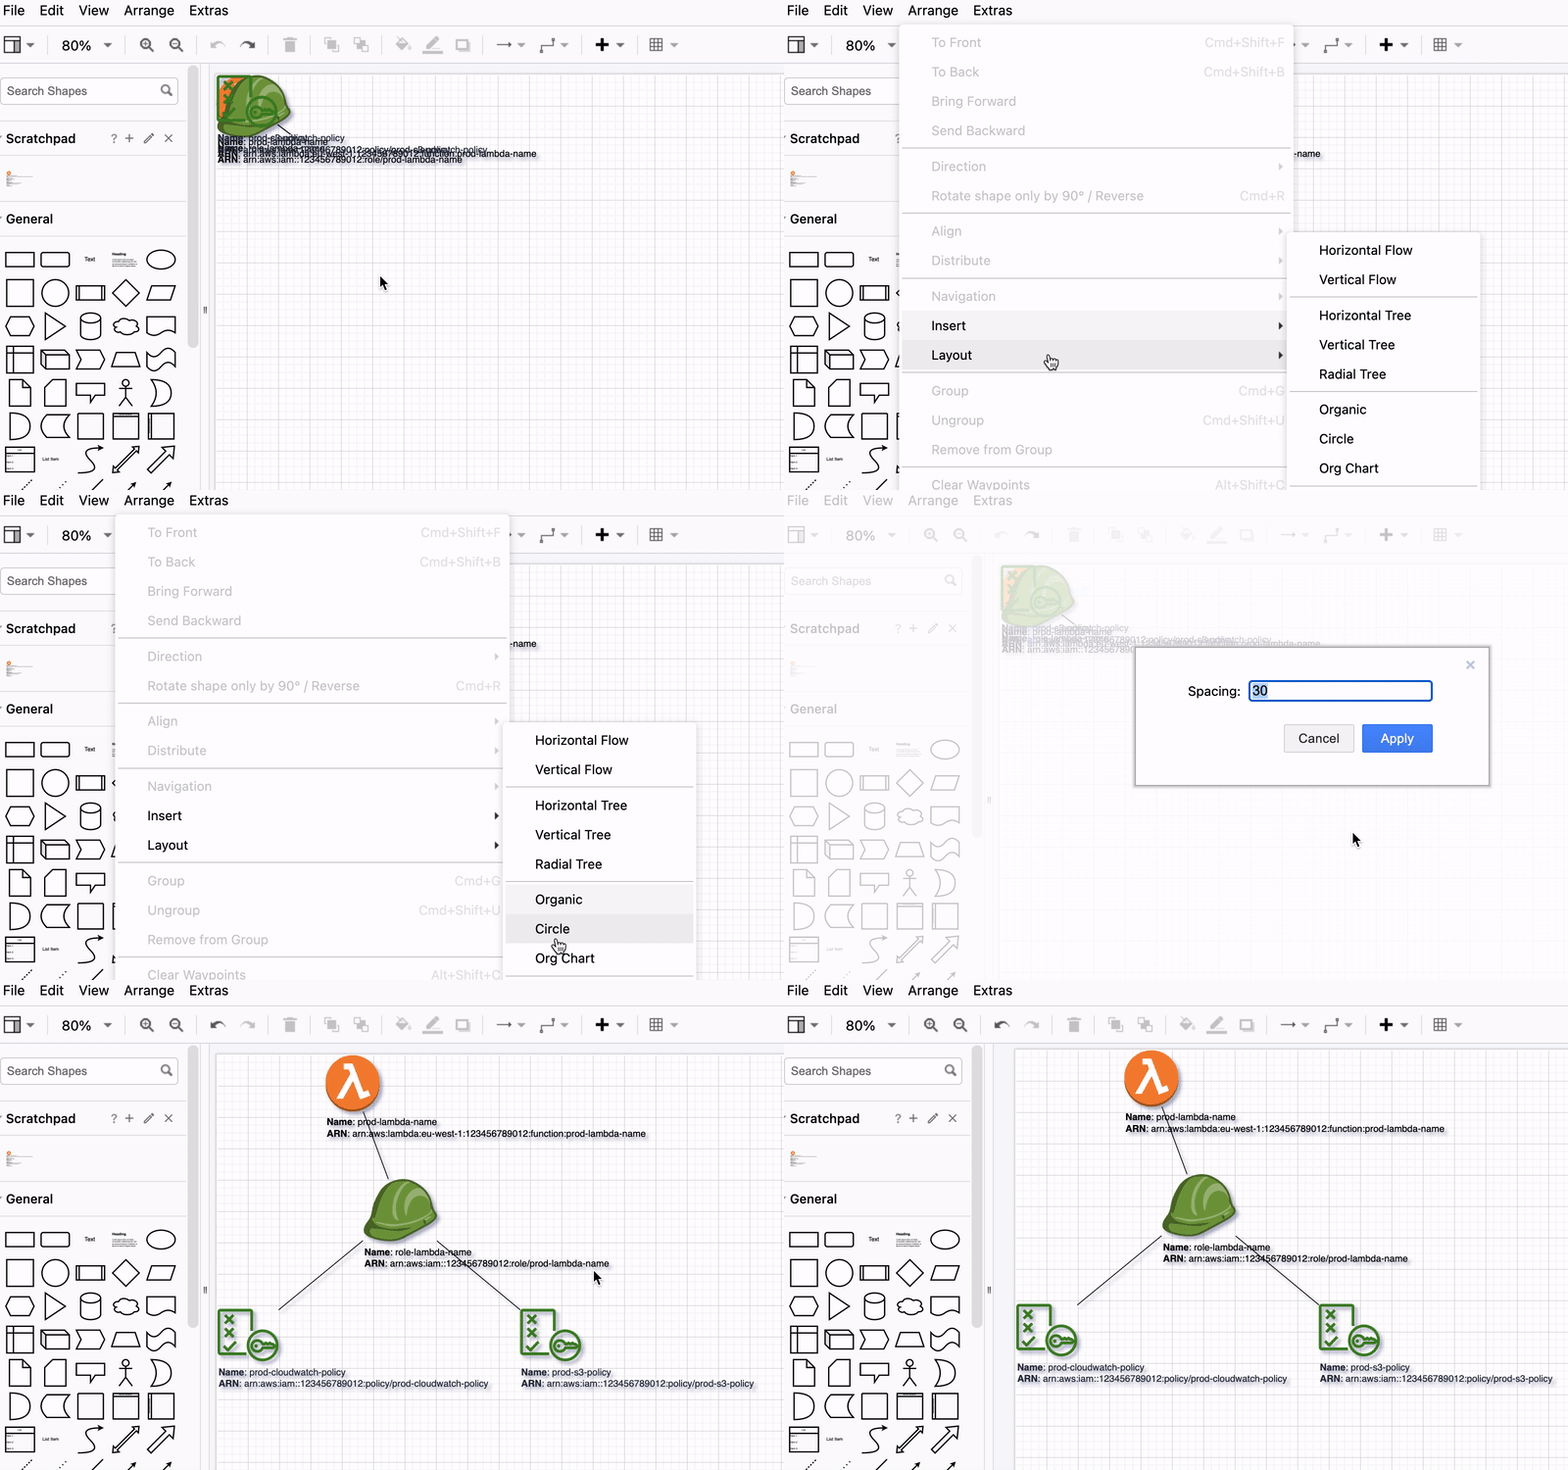
For more advanced use cases, detailed customization options, and in-depth functionalities, please continue exploring the next sections in our documentation. There, you will find a wealth of information to help you leverage the full potential of multicloud-diagrams in your projects. Happy diagramming!