Remote Debugging/Profiling NodeJS app running in private ECS cluster using AWS SSM and inspect protocol
Debugging a Node.js application running inside a container within an ECS cluster can be daunting. The challenge becomes especially significant in restricted environments like AWS ECS, where you lack direct control over the running workloads. Traditional debugging methods, such as SSH or exposing ports, are often not viable in these setups.
AWS provides a secure and efficient solution through AWS Systems Manager (SSM). By leveraging SSM documents and port forwarding, you can securely establish connections to your Node.js containers and expose the debugger port without compromising the security of your infrastructure.
In this post, we will walk through the steps to set up and perform remote debugging of a Node.js container using an SSM.
Debugging
The Node.js debugging process using the --inspect flag allows developers to attach a debugging client (such as Chrome DevTools) to the application and analyze its behavior in real-time.
Node.js uses the Chrome DevTools Protocol (CDP) for debugging.
Capabilities of Node.js Inspector:
- Breakpoints: Pause execution at specific lines to inspect the state of variables and objects.
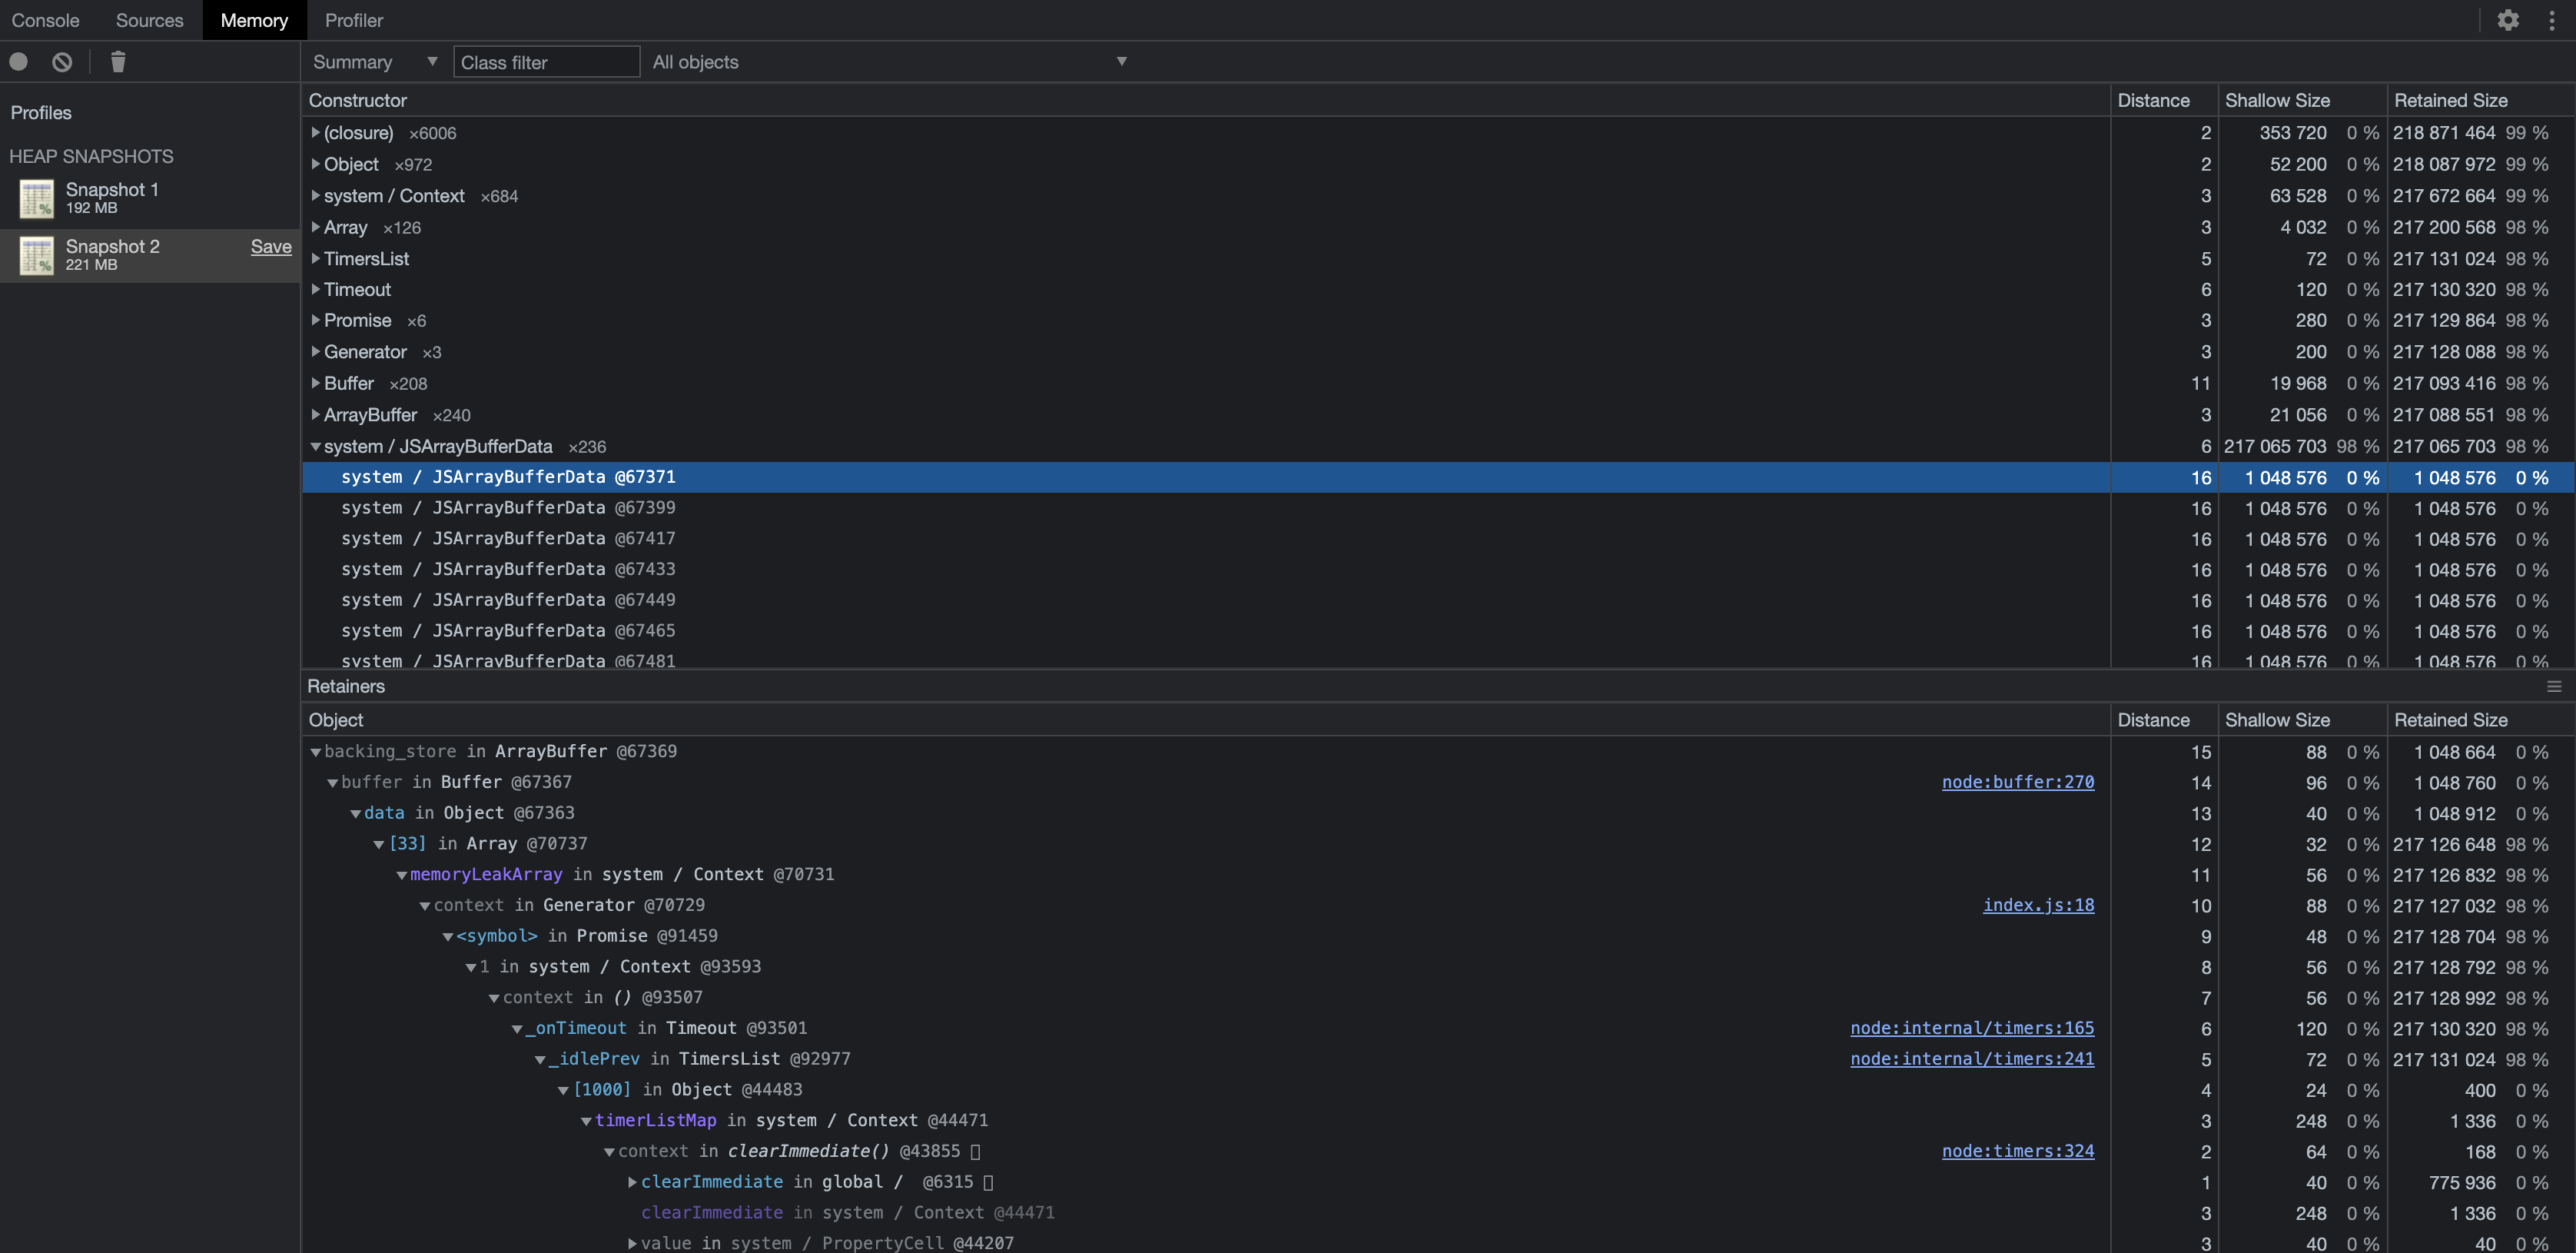
- Heap Analysis: Capture and analyze snapshots of memory usage to identify leaks.
- Call Stack: View the sequence of function calls leading to a particular point in execution.
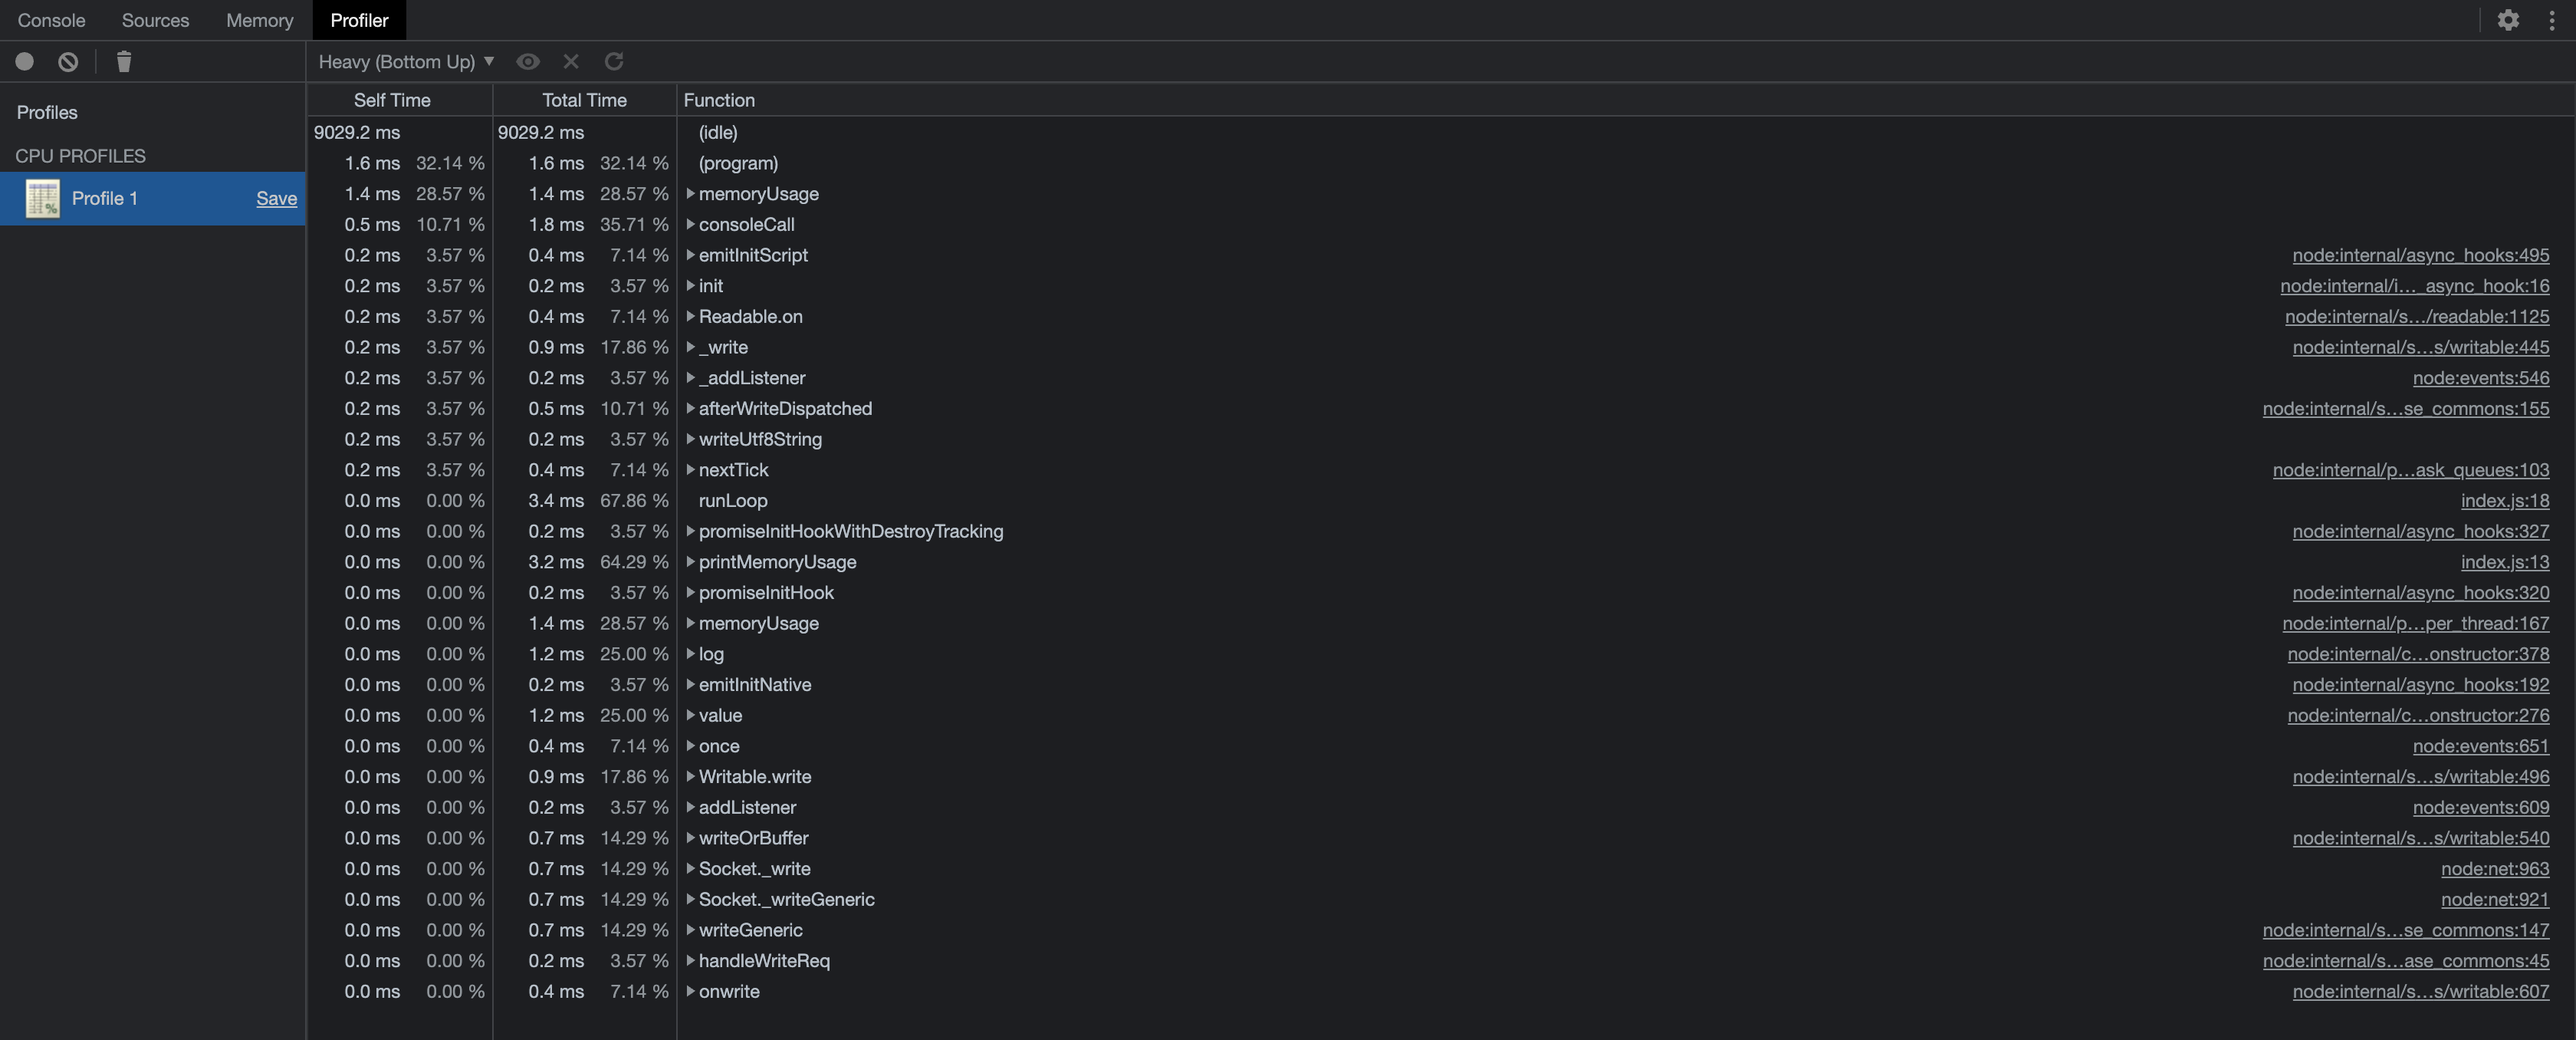
- Performance Profiling: Measure the performance of code execution and detect bottlenecks.
- Step Execution: Step through code one line at a time to observe how the application progresses.
If successful, you’ll see output indicating that the port has been forwarded and the session is waiting for connections.
AWS ECS specifics and limitations for debugger setup
The main challenge in remote debugging is enabling port-forwarding between the application runtime and the machine where the debugger (e.g., Chrome DevTools) is running. This process is straightforward in local environments but complex in cloud-managed services like ECS.
Key challenges include:
- Lack of direct access to the underlying infrastructure: ECS manages the container instances, making traditional SSH-based debugging methods impossible.
- Maintaining security: Exposing debugger ports publicly can introduce vulnerabilities.
- Securely forwarding ports: Ensuring the debugger port is accessible only to authorized clients while retaining private IP configurations.
AWS SSM addresses these issues by allowing secure execution of commands and port forwarding on remote workloads, providing a robust solution for debugging applications running in ECS.
Step 1: Prepare the Node.js Application
To debug the Node.js application, it must be started with the –inspect flag enabled. This exposes the debugging interface on a specified port.
Modify the ECS task definition to include the following command:
1
"command": ["node", "--inspect=0.0.0.0:9229", "app.js"]
1
2
3
4
5
6
7
/usr/src/node-red # node --inspect index.js
Debugger listening on ws://127.0.0.1:9229/9d82bc40-6fe9-4148-b1e8-8089b3351b9f
For help, see: https://nodejs.org/en/docs/inspector
Data
Starting memory leak simulation...
Memory usage: 3 MB
Memory usage: 3 MB
Here is a test sample application that emulates memory leak for analysis:
1
2
3
4
5
6
7
8
9
10
11
12
13
14
15
16
17
18
19
20
21
22
23
24
25
const memoryLeakArray = [];

function createLeak() {
  const leakObject = {
    timestamp: new Date(),
    data: Buffer.alloc(1024 * 1024) // Allocate 1MB of memory
  };
  memoryLeakArray.push(leakObject);
}

function printMemoryUsage() {
  const used = process.memoryUsage();
  console.log(`Memory usage: ${Math.round(used.heapUsed / 1024 / 1024)} MB`);
}

async function runLoop() {
  while (true) {
    createLeak();
    printMemoryUsage();
    await new Promise(resolve => setTimeout(resolve, 1000)); // 1 second delay
  }
}

console.log("Starting memory leak simulation...");
runLoop();
After making this change, redeploy the ECS task.
Step 2: Use SSM to Connect to the Container
AWS provides several predefined Systems Manager documents (SSM documents) for various tasks, and AWS-StartPortForwardingSession is among them. This document allows secure port forwarding from an AWS resource (such as an ECS container) to your local machine.
To forward the Node.js debugging port (9229) to your local machine, run:
1
2
3
4
5
6
7
8
9
10
aws ssm start-session \
--target ecs:<cluster-name>_<task-id>_<container-runtime-id> \
--document-name AWS-StartPortForwardingSession \
--parameters '{"portNumber":["9229"], "localPortNumber":["9229"]}'

Starting session with SessionId: xxxx-xxxx
Port 9229 opened for sessionId xxxx-xxxx.
Waiting for connections...

Connection accepted for session [xxxx-xxxx]
Step 3: Debug the Application
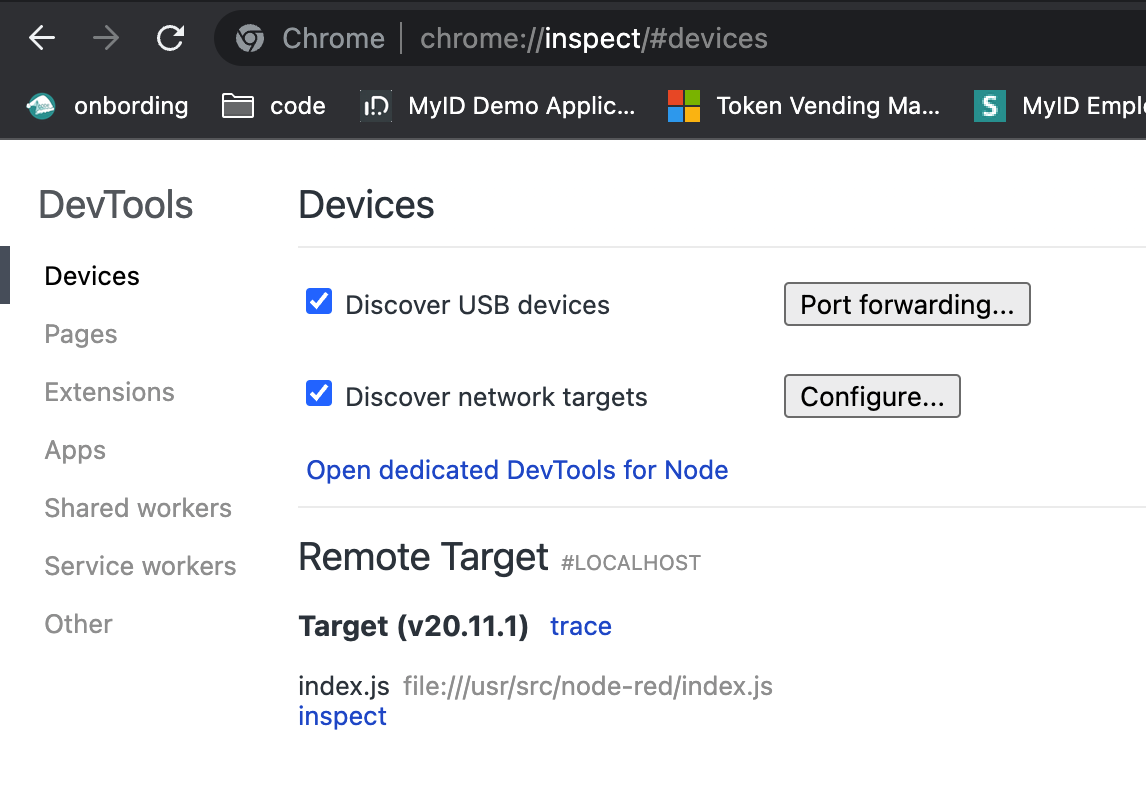
Open Chrome and navigate to chrome://inspect.
Under “Remote Target,” locate the forwarded debugging session and click “Inspect.”
By default, Chrome is configured with 9229 port, but you can use any custom port that was decided to be used for debugging.
Use Chrome DevTools to analyze and debug the Node.js process:
At the same time in console output message of remote debugger attached will be listed.
1
2
3
4
5
Memory usage: 3 MB
Debugger attached.
Memory usage: 3 MB
Memory usage: 3 MB
Memory usage: 3 MB
Monitor the event loop:
Analyze heap snapshots to identify memory leaks:
Step through code execution to pinpoint issues:
Conclusion
The beauty of this solution is a high security - the debugging port does not need to be exposed publicly, tunel is initiated dynamically between machine and container. Even having no inbound/outbound, security groups for cluster (fully private isolated one) we can access to workloads. And access to such Private Networks without additional network configuration decreases operational overhead.


