Understanding Access Patterns in DynamoDB. Part1: Why Naive Reads and Entity Updates Can Cause Multiple Problems
DynamoDB, AWS’s NoSQL database service, is designed for scalability and performance. However, getting the best out of DynamoDB requires a deep understanding of access patterns.
Introduction
A common pitfall for new users is relying on naive read and entity update strategies, which can lead to significant issues in performance, consistency, and cost.
In this post, we’ll explore these access patterns, explain why they are problematic, and discuss best practices for designing efficient and reliable DynamoDB operations.
Naive Reads: The Problem of Inefficient Data Access
A naive read pattern in DynamoDB involves directly querying or scanning a table to retrieve data without considering the efficiency of the operation.
While this approach might seem straightforward, it often leads to several issues.
Entity Updates: The Pitfalls of Naive Write Operations
Naive entity updates involve directly modifying attributes of an item without considering concurrency, consistency, or the potential for data loss. This approach can lead to several serious problems:
Race Conditions:
When multiple processes or users attempt to update the same entity simultaneously, race conditions can occur.
Without proper handling, such as using conditional writes or transactions, one update might overwrite another, leading to inconsistent data.
Lost Updates:
DynamoDB’s default update behavior is “last writer wins,” meaning that if two updates occur simultaneously, the second update will overwrite the first.
This can lead to lost data if multiple processes are updating the same item concurrently without coordination.
Data Inconsistency:
Naive updates that don’t account for versioning or state can result in data inconsistencies. For example, if you update an item without checking its current version or state, you might inadvertently overwrite important changes made by another process.
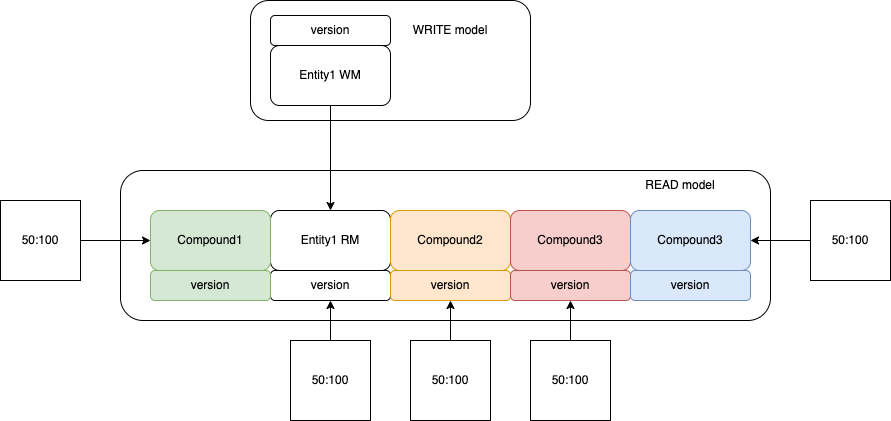
Storage Model for Experiment
We will work with the same Storage model by running multiple experiments to verify data-loss factor and consistency.
In this post we will just see how problem dramatically scales with factor of producers.
Concurrent Experiments
Table Item actually a compound object - it has few attributes tuples each containing individual Domain Object and its version.
Thus, to make experiment even more complex we will assume that there are multiple producers that are updating same item in table by PK but each producer performs update of its own Sub-Entity and its version (with any update version is incremented).
Running different combination of producers and its concurrency level, we will track the final version numbers and state of Entities, by knowing that each consumer is granted to perform 1000 ops.
Workers in Experiments
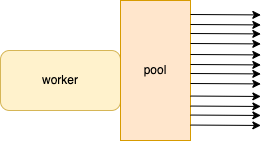
Each worker has a pool of concurrent operations. In experiment we will scale both workers count and pool size of each worker.
Producers Diagram
Naive-approach Experiment of lost updates based on concurrency factor
1
2
3
4
5
6
7
8
9
10
11
12
13
14
15
16
17
18
19
20
21
22
23
24
25
26
27
28
29
30
31
32
33
34
35
36
37
38
39
40
41
42
43
44
45
46
47
48
49
50

def update_item(primary_key_value, entity_id):
  dynamodb = boto3.resource('dynamodb')
  table = dynamodb.Table('ReadModelTable')

  response = table.get_item(
    Key={
      'PrimaryKey': primary_key_value
    }
  )
  item = response.get('Item')

  if f'{entity_id}_version' in item:
    version = item[f'{entity_id}_version'] + 1  # Increment the version
    item[f'{entity_id}_version'] = version
    item[entity_id] = {
      'Name': entity_id,
      'version': version
    }
  else:
    item[f'{entity_id}_version'] = 1  # Initialize if it doesn't exist

  table.put_item(Item=item)


def main():
  # Arguments passed to the script
  args = sys.argv[1:]
  primary_key = args[0]
  req_count = int(args[1])
  workers = int(args[2])
  entity_id = args[3]

  primary_keys = [primary_key]  # List of primary keys to update
  primary_keys = primary_keys * req_count  # 100 ops

  with ThreadPoolExecutor(max_workers=workers) as executor:
    # Start the load operations and mark each future with its primary key
    futures = {executor.submit(update_item, key, entity_id): key for key in primary_keys}

    for future in as_completed(futures):
      primary_key = futures[future]
      try:
        future.result()
      except Exception as e:
        print(f"Exception occurred for {primary_key}: {e}")


if __name__ == "__main__":
  main()
Experiment Results:
Everything is perfect when we have single producer that writes sequentially (does not work on production, but works on my machine approach).
1 Worker: updates single Entity in compound object
We performed 1000 update requests with counter increment and its value corresponds to expected results:
| Requests | Workers | Pool-size | Entities under update | Entity1 ver |
|---|---|---|---|---|
| 1000 | 1 | 1 | 1 | 1000 |
But once even single producer is scaled we are noting lost writes:
| Requests | Workers | Pool-size | Entities under update | Entity1 ver |
|---|---|---|---|---|
| 1000 | 1 | 1 | 1 | 1000 |
| 1000 | 1 | 2 | 1 | 600 |
| 1000 | 1 | 4 | 1 | 430 |
| 1000 | 1 | 8 | 1 | 321 |
| 1000 | 1 | 16 | 1 | 218 |
| 1000 | 1 | 32 | 1 | 132 |
| 1000 | 1 | 64 | 1 | 92 |
| 1000 | 1 | 128 | 1 | 71 |
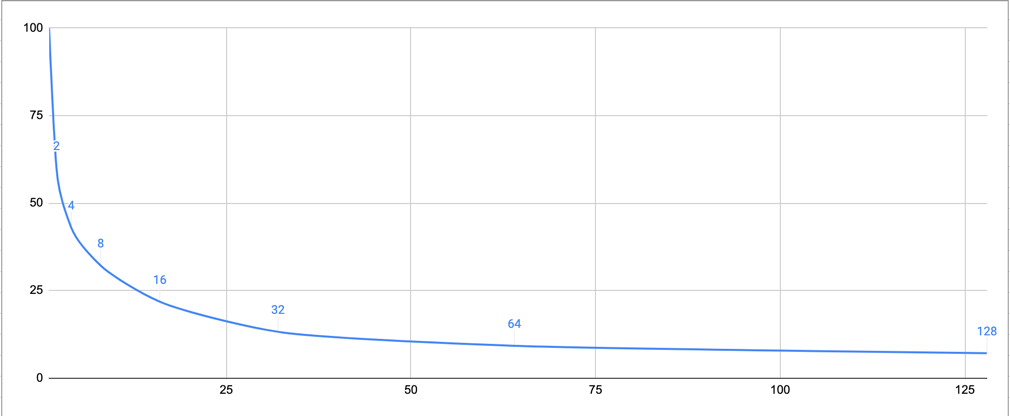
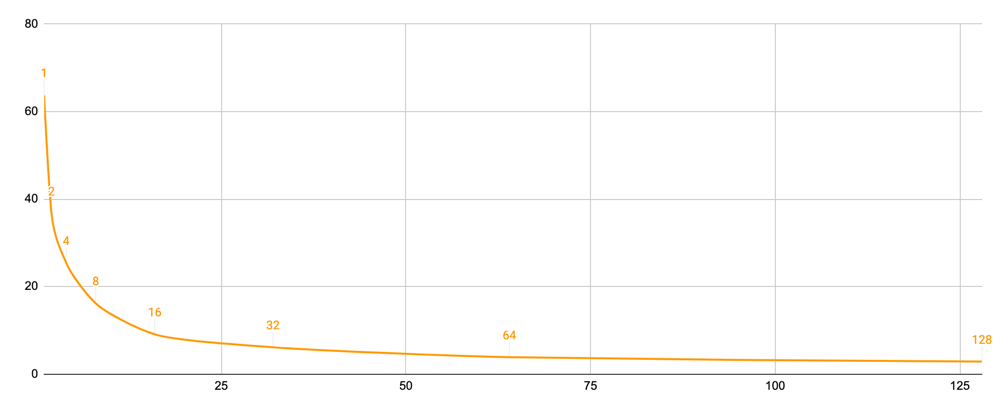
Take a look that the writes-lose is a factor of concurrent request. Thus pool of 128 concurrent requests are showing 14-times consistency decrease.
Data volume Consistency starts as 100% at single element pool, but drops down once more concurrency is added.
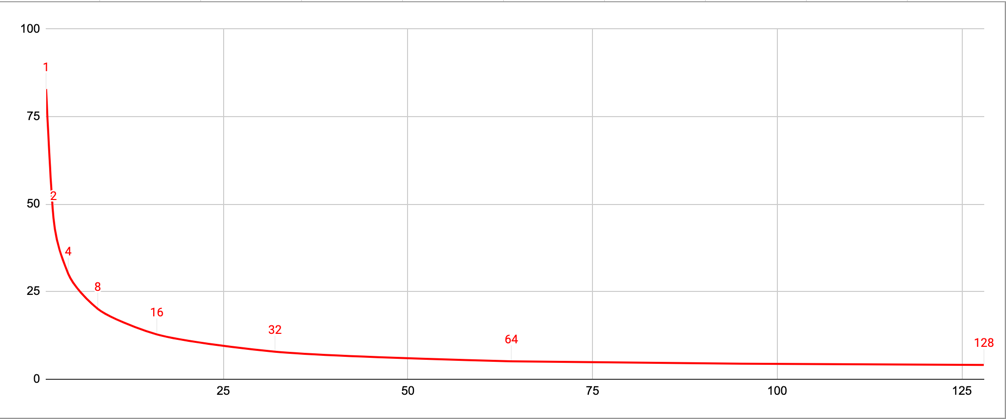
The problem scales dramatically as buzz-factor on adding every next producer:
2 Workers: each update own Entity in compound object
| Requests | Workers | Pool-size | Entities under update | Entity1 ver | Entity2 ver |
|---|---|---|---|---|---|
| 1000 | 2 | 1 | 2 | 829 | 828 |
| 1000 | 2 | 2 | 2 | 461 | 459 |
| 1000 | 2 | 4 | 2 | 261 | 341 |
| 1000 | 2 | 8 | 2 | 202 | 199 |
| 1000 | 2 | 16 | 2 | 131 | 124 |
| 1000 | 2 | 32 | 2 | 67 | 89 |
| 1000 | 2 | 64 | 2 | 41 | 60 |
| 1000 | 2 | 128 | 2 | 38 | 42 |
3 Workers: each update own Entity in compound object
| Requests | Workers | Pool-size | Entities under update | Entity1 ver | Entity2 ver | Entity3 ver |
|---|---|---|---|---|---|---|
| 1000 | 3 | 1 | 3 | 623 | 646 | 643 |
| 1000 | 3 | 2 | 3 | 316 | 324 | 462 |
| 1000 | 3 | 4 | 3 | 240 | 244 | 278 |
| 1000 | 3 | 8 | 3 | 147 | 153 | 184 |
| 1000 | 3 | 16 | 3 | 93 | 85 | 94 |
| 1000 | 3 | 32 | 3 | 61 | 64 | 58 |
| 1000 | 3 | 64 | 3 | 27 | 52 | 36 |
| 1000 | 3 | 128 | 3 | 38 | 23 | 24 |
4 Workers: each update own Entity in compound object
| Requests | Workers | Pool-size | Entities under update | Entity1 ver | Entity2 ver | Entity3 ver | Entity4 ver |
|---|---|---|---|---|---|---|---|
| 1000 | 4 | 1 | 4 | 423 | 453 | 372 | 468 |
| 1000 | 4 | 2 | 4 | 316 | 279 | 306 | 309 |
| 1000 | 4 | 4 | 4 | 179 | 180 | 210 | 216 |
| 1000 | 4 | 8 | 4 | 111 | 115 | 141 | 112 |
| 1000 | 4 | 16 | 4 | 63 | 76 | 83 | 64 |
| 1000 | 4 | 32 | 4 | 58 | 41 | 36 | 60 |
| 1000 | 4 | 64 | 4 | 37 | 27 | 28 | 34 |
| 1000 | 4 | 128 | 4 | 34 | 18 | 13 | 25 |
5 Workers: each update own Entity in compound object
| Requests | Workers | Pool-size | Entities under update | Entity1 ver | Entity2 ver | Entity3 ver | Entity4 ver | Entity5 ver |
|---|---|---|---|---|---|---|---|---|
| 1000 | 5 | 1 | 5 | 454 | 461 | 483 | 499 | 517 |
| 1000 | 5 | 2 | 5 | 298 | 244 | 278 | 270 | 244 |
| 1000 | 5 | 4 | 5 | 171 | 156 | 202 | 153 | 156 |
| 1000 | 5 | 8 | 5 | 95 | 106 | 108 | 91 | 98 |
| 1000 | 5 | 16 | 5 | 57 | 66 | 61 | 86 | 71 |
| 1000 | 5 | 32 | 5 | 42 | 47 | 44 | 50 | 47 |
| 1000 | 5 | 64 | 5 | 39 | 23 | 31 | 26 | 30 |
| 1000 | 5 | 128 | 5 | 30 | 9 | 13 | 20 | 10 |
Timing metrics
This metrics for documentation purpose - they will be used to compare writes speed with during future experiments with thread-safe technics:
| Requests | Workers | Pool-size | req/sec | duration, sec |
|---|---|---|---|---|
| 1000 | 1 | 1 | 4.18 | 239 |
| 1000 | 1 | 2 | 8.26 | 121 |
| 1000 | 1 | 4 | 15.63 | 64 |
| 1000 | 1 | 8 | 26.32 | 38 |
| 1000 | 1 | 16 | 45.45 | 22 |
| 1000 | 1 | 32 | 41.67 | 24 |
| 1000 | 1 | 64 | 38.46 | 26 |
| 1000 | 1 | 128 | 28.57 | 35 |
| Requests | Workers | Pool-size | req/sec | duration, sec |
|---|---|---|---|---|
| 1000 | 2 | 1 | 6.87 | 291 |
| 1000 | 2 | 2 | 16.53 | 121 |
| 1000 | 2 | 4 | 30.77 | 65 |
| 1000 | 2 | 8 | 54.05 | 37 |
| 1000 | 2 | 16 | 68.97 | 29 |
| 1000 | 2 | 32 | 68.97 | 29 |
| 1000 | 2 | 64 | 60.61 | 33 |
| 1000 | 2 | 128 | 32.79 | 61 |
| Requests | Workers | Pool-size | req/sec | duration, sec |
|---|---|---|---|---|
| 1000 | 3 | 1 | 12.61 | 238 |
| 1000 | 3 | 2 | 24.39 | 123 |
| 1000 | 3 | 4 | 45.45 | 66 |
| 1000 | 3 | 8 | 63.83 | 47 |
| 1000 | 3 | 16 | 83.33 | 36 |
| 1000 | 3 | 32 | 57.69 | 52 |
| 1000 | 3 | 64 | 54.55 | 55 |
| 1000 | 3 | 128 | 42.25 | 71 |
| Requests | Workers | Pool-size | req/sec | duration, sec |
|---|---|---|---|---|
| 1000 | 4 | 1 | 17.24 | 232 |
| 1000 | 4 | 2 | 33.90 | 118 |
| 1000 | 4 | 4 | 64.52 | 62 |
| 1000 | 4 | 8 | 100.00 | 40 |
| 1000 | 4 | 16 | 114.29 | 35 |
| 1000 | 4 | 32 | 90.91 | 44 |
| 1000 | 4 | 64 | 81.63 | 49 |
| 1000 | 4 | 128 | 53.33 | 75 |
| Requests | Workers | Pool-size | req/sec | duration, sec |
|---|---|---|---|---|
| 1000 | 5 | 1 | 17.39 | 230 |
| 1000 | 5 | 2 | 42.74 | 117 |
| 1000 | 5 | 4 | 80.65 | 62 |
| 1000 | 5 | 8 | 119.05 | 42 |
| 1000 | 5 | 16 | 121.95 | 41 |
| 1000 | 5 | 32 | 106.38 | 47 |
| 1000 | 5 | 64 | 78.13 | 64 |
| 1000 | 5 | 128 | 49.50 | 101 |
Conclusions
This reports shows multiple problems that occur on production systems that are operating with naive write with pre-loading approach.
In future posts we will overview and compare different optimisation technics to improve data quality and will see in which situations to use-or-not-to-use them for storage consistent results:
- strong consistent reads
- attribute-based updates with expressions
- conditional updates
- locking subsystem
References (Links)
AppendixA: Full experiment metrics
| Requests | Workers | Pool-size | Entities under update | Entity1 ver | Entity2 ver | Entity3 ver | Entity4 ver | Entity5 ver |
|---|---|---|---|---|---|---|---|---|
| 1000 | 1 | 1 | 1 | 1000 | 0 | 0 | 0 | 0 |
| 1000 | 1 | 2 | 1 | 600 | 0 | 0 | 0 | 0 |
| 1000 | 1 | 4 | 1 | 430 | 0 | 0 | 0 | 0 |
| 1000 | 1 | 8 | 1 | 321 | 0 | 0 | 0 | 0 |
| 1000 | 1 | 16 | 1 | 218 | 0 | 0 | 0 | 0 |
| 1000 | 1 | 32 | 1 | 132 | 0 | 0 | 0 | 0 |
| 1000 | 1 | 64 | 1 | 92 | 0 | 0 | 0 | 0 |
| 1000 | 1 | 128 | 1 | 71 | 0 | 0 | 0 | 0 |
| 1000 | 2 | 1 | 2 | 829 | 828 | 0 | 0 | 0 |
| 1000 | 2 | 2 | 2 | 461 | 459 | 0 | 0 | 0 |
| 1000 | 2 | 4 | 2 | 261 | 341 | 0 | 0 | 0 |
| 1000 | 2 | 8 | 2 | 202 | 199 | 0 | 0 | 0 |
| 1000 | 2 | 16 | 2 | 131 | 124 | 0 | 0 | 0 |
| 1000 | 2 | 32 | 2 | 67 | 89 | 0 | 0 | 0 |
| 1000 | 2 | 64 | 2 | 41 | 60 | 0 | 0 | 0 |
| 1000 | 2 | 128 | 2 | 38 | 42 | 0 | 0 | 0 |
| 1000 | 3 | 1 | 3 | 623 | 646 | 643 | 0 | 0 |
| 1000 | 3 | 2 | 3 | 316 | 324 | 462 | 0 | 0 |
| 1000 | 3 | 4 | 3 | 240 | 244 | 278 | 0 | 0 |
| 1000 | 3 | 8 | 3 | 147 | 153 | 184 | 0 | 0 |
| 1000 | 3 | 16 | 3 | 93 | 85 | 94 | 0 | 0 |
| 1000 | 3 | 32 | 3 | 61 | 64 | 58 | 0 | 0 |
| 1000 | 3 | 64 | 3 | 27 | 52 | 36 | 0 | 0 |
| 1000 | 3 | 128 | 3 | 38 | 23 | 24 | 0 | 0 |
| 1000 | 4 | 1 | 4 | 423 | 453 | 372 | 468 | 0 |
| 1000 | 4 | 2 | 4 | 316 | 279 | 306 | 309 | 0 |
| 1000 | 4 | 4 | 4 | 179 | 180 | 210 | 216 | 0 |
| 1000 | 4 | 8 | 4 | 111 | 115 | 141 | 112 | 0 |
| 1000 | 4 | 16 | 4 | 63 | 76 | 83 | 64 | 0 |
| 1000 | 4 | 32 | 4 | 58 | 41 | 36 | 60 | 0 |
| 1000 | 4 | 64 | 4 | 37 | 27 | 28 | 34 | 0 |
| 1000 | 4 | 128 | 4 | 34 | 18 | 13 | 25 | 0 |
| 1000 | 5 | 1 | 5 | 454 | 461 | 483 | 499 | 517 |
| 1000 | 5 | 2 | 5 | 298 | 244 | 278 | 270 | 244 |
| 1000 | 5 | 4 | 5 | 171 | 156 | 202 | 153 | 156 |
| 1000 | 5 | 8 | 5 | 95 | 106 | 108 | 91 | 98 |
| 1000 | 5 | 16 | 5 | 57 | 66 | 61 | 86 | 71 |
| 1000 | 5 | 32 | 5 | 42 | 47 | 44 | 50 | 47 |
| 1000 | 5 | 64 | 5 | 39 | 23 | 31 | 26 | 30 |
| 1000 | 5 | 128 | 5 | 30 | 9 | 13 | 20 | 10 |


